Archive for the ‘Uncategorized’ Category

PAR Review: 2010-2014

Monday, March 9th, 2015

With the DTBL Draft scheduled to begin later this week, teams are no doubt planning for their future.  But before we go there, I’d  like to take a moment to step back in time.  One of my projects for this winter has been to retroactively calculate PAR stats for previous seasons.  At a minimum, my goal was to complete the five most recent seasons to give me a decent sample size to analyze the numbers and provide a basis for something else I will be tackling down the road.  So that is exactly what I did.  PAR numbers have been calculated for all DTBL players dating back to the 2010 season.  Eventually, I hope to get this completed all the way back to the beginning of the league, but it will be a slow process.  But for now, I’d like to take a closer look at the five years worth of data I have compiled, draw some conclusions from the data and analyze how these numbers match up with the way league members valued players each year in the DTBL Awards votes.  This will also be a bit of a look at league trends over this five year period.

First, I don’t want to assume you all remember every last detail about the Points Above Replacement statistic I introduced last summer.  If you need a PAR primer, I highly recommend skimming through my introductory article.  In an incredibly brief summary, the purpose of PAR is to determine a player’s value in terms of the number of points he contributes to his team in the standings over a replacement level player.  In theory, a player with a 5.0 PAR means that the team earned approximately five more points in the standings than they would have if they had used a replacement level player to fill that roster spot instead.

Now it’s time to look at the results at a macro level.  To assist with this, I quickly put together a new page which contains year-by-year league-wide totals in all statistical categories, including PAR.  For now, that single table is the only thing on the page, but eventually I envision adding a lot more data and making it sort of a league almanac.  Here it is.  You may want to open that page in a new tab because I will be referencing it a bunch.  For now, you can reach the page on the league site by clicking on the “Archives” header.  I may move it elsewhere later though.

Since the idea behind the “replacement level” setting for PAR was a team full of players that would finish in last place in each category, I would expect the total PAR earned by every player in the league during the season to be approximately 450.  That’s 45 points to be gained by nine non-last place finishing teams in each of the 10 categories.  As you can see in that table I just linked, the league’s total PAR in the five years I have computed so far was very close to the expected 450 in the 2010-12 seasons, but has fallen well short each of the last two years.  But when you break it out into batting PAR and pitching PAR, the results are not very close to the expected 225 in most cases.  In most years, batters have fallen well short of the expected total while pitchers have far exceeded it.  But I think there is a very logical explanation for this, and overall, I am pleased with the results so far.  Here’s why:

As I mentioned in the initial PAR article, I decided to use a span of five years to set the replacement level baseline and determine the values needed to earn points in each category.  I did this because I didn’t want huge fluctuations in the numbers used to compute PAR from one year to the next.  So a player who puts up identical numbers in consecutive years should have more or less the same PAR.  But the downside to using a five year sample is that drastic shifts in league-wide stat totals throws the baseline out of whack.  And that’s exactly what has happened in this league for over a decade now.  Offensive numbers have been on a steady decline since the heart of the steroid era and pitching numbers have drastically improved.  Looking at that table again, you will see that with the exception of 2012, the league batting average and ERA have gone down every season since 2006.  The last two years, in particular, have seen incredible drops in offensive production.  2014 was the first season since this league expanded to 10 teams in 1998 that DTBL players failed to accumulate 1000 runs scored.  The league ERA and WHIP were at all time lows, by a fairly comfortable margin.

Because these trends have been consistently heading in one direction over the five years I’ve examined so far (really, it’s nine years since the ’10 PAR calculations include numbers dating back to ’06), the season in question was always being compared to a sample set of five years with higher offensive output and less impressive pitching stats.  Therefore, batters failing to accumulate a league-wide total of 225 PAR is to be expected.  The extent to which hitters have failed to reach 225 PAR has exceeded the amount in which pitchers have gone past that number in most seasons.  This is because pitching PAR contains two stats that have been extremely consistent from year-to-year and aren’t particularly affected by the lack of offense in recent years:  wins and saves.  So while hitters have at least four categories that have seen tumbling totals (AVG, HR, RBI, R), the effect on pitching stats has been mostly limited to three categories (ERA, WHIP, K).

Once I finally start to compute PAR in seasons that didn’t have a drastic change in league totals compared to the previous five seasons, we should start to see these numbers come much closer to the expected values.  Actually, we already have one such season in 2012.  2012 was actually a slightly better year for hitters than the previous two seasons and was right in line with the five year averages from ’08-’12.  So it is encouraging to see that the batting and pitching PAR totals were both right around 225 that year.  In conclusion from looking at the league PAR totals, the numbers may seem out of whack and pitchers are certainly earning points at a higher rate than hitters, but I do not think this negates the value of the stat.  You just need to keep these things in mind when determining how you personally value each player.

Now I’d like to take a look at the top PAR earning batters and pitchers in each of the five seasons and see how those players finished in the DTBL MVP and Cy Young votes in the corresponding season.  The reason why I think this is something worth looking at is to see how the value league members have placed on particular players has matched up with the value determined by PAR.

2014

PAR rank Batter MVP finish Pitcher CY finish
1st Mike Trout 1st Clayton Kershaw 1st
2nd Jose Altuve 4th Johnny Cueto 2nd
3rd Michael Brantley 5th Felix Hernandez 3rd
4th Giancarlo Stanton 2nd Corey Kluber 4th
5th Jose Bautista 7th Adam Wainwright 5th(t)

2014 was the first season in which voters actually had PAR numbers to reference if they were so inclined. Not surprisingly, the PAR numbers back up the voters, especially for Cy Young. Victor Martinez finished 3rd in the MVP vote despite finishing 6th in PAR, but this is mainly due to his position value. But that’s a whole different topic for another time. It appears Jose Altuve was slightly undervalued by voters, at least if PAR is to be trusted, since he was just barely behind Trout in PAR.

2013

PAR rank Batter MVP finish Pitcher CY finish
1st Miguel Cabrera 1st Clayton Kershaw 1st
2nd Chris Davis 2nd Max Scherzer 2nd
3rd Mike Trout 4th Adam Wainwright 4th
4th Paul Goldschmidt 3rd Yu Darvish 3rd
5th Adam Jones 5th Cliff Lee 6th

The ’12-’13 seasons featured hotly contested debates on Miguel Cabrera vs. Mike Trout for AL MVP. It was a little more clear cut in this league though, at least in ’13, with Cabrera having the superior fantasy stats. It’s also interesting to see how close Kershaw and Scherzer were to each other in both PAR and the Cy Young vote. The result was the same in each, with a slight edge to Kershaw. A little sad to see those 4th and 5th place names on the pitching side in light of their current arm injuries.

2012

PAR rank Batter MVP finish Pitcher CY finish
1st Mike Trout 2nd Justin Verlander 2nd
2nd Ryan Braun 3rd David Price 1st
3rd Miguel Cabrera 1st Clayton Kershaw 3rd
4th Josh Hamilton 4th Gio Gonzalez 4th
5th Andrew McCutchen 5th Matt Cain 6th(t)

Now this is where things get interesting. PAR disagrees with both the MVP and Cy Young selections from ’12. I wouldn’t classify either as egregious errors by the voters though. Cabrera and Price both helped lead the Naturals to the championship that season, so they probably earned a slight edge over Trout, Braun and Verlander in the minds of some for that reason alone. Also, the PAR differences were minimal anyway. Having said that, Trout’s 10.8 PAR is the highest single season number we’ve seen for a batter in the five years I’ve calculated so far, yet he didn’t win the MVP. I should note that Craig Kimbrel finished 5th in the Cy Young vote in both ’12 and ’13, but relief pitchers have almost no chance of finishing near the leaders in pitching PAR. Make of that what you wish.

2011

PAR rank Batter MVP finish Pitcher CY finish
1st Matt Kemp 1st Justin Verlander 1st
2nd Jacoby Ellsbury 3rd Clayton Kershaw 2nd
3rd Ryan Braun 2nd Roy Halladay 3rd
4th Curtis Granderson 4th Cliff Lee 4th
5th Jose Bautista 6th Jered Weaver 5th

This is another season where the PAR rankings closely match the award voting results. Remember when Matt Kemp was the best player in baseball? It was only four years ago! Meanwhile, Verlander was a unanimous Cy Young selection in ’11 and also accumulated the highest PAR I have calculated to date (16.3), barely edging out Kershaw’s ’14 campaign.

2010

PAR rank Batter MVP finish Pitcher CY finish
1st Carlos Gonzalez 2nd Roy Halladay 1st
2nd Albert Pujols 1st Adam Wainwright 2nd
3rd Joey Votto 4th Felix Hernandez 3rd
4th Miguel Cabrera 3rd Ubaldo Jimenez 5th
5th Carl Crawford 7th C.C. Sabathia 4th

Finally, 2010 saw Pujols edge out CarGo for the MVP award despite finishing slightly behind him in PAR. But that was an extremely tight MVP vote as well with Pujols winning despite only receiving three first place votes. Less than a point separated the two in PAR. On the pitching side, the two lists were nearly identical.

To me, all of the above points out that PAR is a pretty good representation of the value most league members have placed on players in recent years and helps indicate that no player has been clearly snubbed from a post-season award either.  I hope to do more analysis like this as I continue to compute PAR values from previous seasons.

With the draft starting this week, you may be contemplating whether or not you are going to consider PAR when making your selections.  Let me offer a little unsolicited advice and provide some guidance for you if you are going to go that route.  If you are already using a set of stat projections to assist you with your drafting process, it may be worthwhile to calculate a player’s projected PAR too.  This could be particularly useful if you are debating between two players with completely different skill sets.  However, you should also consider position scarcity and not necessarily draft the player capable of posting the highest PAR.  2014 PAR calculations for all draft eligible players can be found on the “Free Agents” page.  But I want to give you a huge heads up that these numbers are close to meaningless for players who were not active for the full season last year.  The PAR calculation assumes they played the full season, which is probably not the case for a majority of the players.  Same goes for the PAR numbers you see on the individual team pages right now.

In case you are interested in calculating 2015 projected PAR for players, I have pasted the formulas below for both batters and pitchers.  These are the numbers that were used to compute the ’14 PAR totals and will be used during this season as well.  The only difference is these formulas are assuming full season stats.  So if your projected numbers aren’t full season, the PAR is probably going to be a little low.  Anyway, you can plug this formula into Excel, and replace the stat names with the projected values you wish to use.

Batting PAR:

=((((H+1775)/(AB+6912))-0.2567)/0.0028) + ((HR-15.05)/9.67) + ((RBI-63.25)/24.48) + ((R-65.19)/24.34) + ((SB-7.68)/9.48)

Pitching PAR:

=((((ER+495.13)*9/(IP+1140.0))-3.909)/-0.095) + ((((BB+H+1469.73)/(IP+1140.0))-1.2893)/-0.0174) + ((W-7.57)/2.75) + ((SV-5.56)/9.57) + ((K-114.47)/31.91)

Of course, these formulas aren’t very useful without numbers to plug into them.  I’m not going to recommend any particular projection set though because I think it is best to leave that up to you to decide.  It wouldn’t be much fun if we were all reading from the same sheet of music.  However, I will recommend checking out FanGraphs, where they have several sets of 2015 stat projections available.

Happy drafting!
PAR for the Course

Saturday, June 14th, 2014


I take a lot of pride in this web site I have developed and enhanced over the years.  Although it lacks some of the bells and whistles you’ll find on the mainstream fantasy baseball sites, this is a fully functional site that handles all of the key elements of fantasy baseball game management.  Just in the last few years, I’ve added a couple new features that I believe have greatly enhanced the overall user experience, namely the live stats tracker and the recent addition of injury notices.  But there is one key element of most fantasy sites that this one has always lacked:  some sort of player rater to help users analyze where their players stack up against the rest of the league.  After several years of spit-balling ideas, I’m happy to announce the addition of a new league statistic that will show up on pages throughout the site:  PAR (Points Above Replacement).

As the name somewhat suggests, PAR is loosely based on the Sabermetric statistic that is now the de facto #1 stat for rating baseball players, WAR – Wins Above Replacement.  Most of you are probably at least somewhat familiar with WAR, but to put it in very simple terms, it is a stat designed to determine player value based on how many additional wins a player helps his team earn compared to how many wins they would have earned with a replacement level player in that roster spot instead.  So let’s say Player A earns a 4.0 WAR for a 90 win team.  The theory is that the team would have instead won 86 games if Player A had been replaced by a “replacement level” player.  If you want to see a full description of WAR, including the definition of what “replacement level” means, I recommend checking out this page.

If determining the number of wins a player is worth is widely accepted as the best way of determining a player’s value in real baseball, what about fantasy baseball?  Well, we don’t care about “wins” (team wins, that is).  But we do care about points.  The goal is to earn as many points in the standings as possible.  So wouldn’t it be useful to know approximately how many points a player is worth?  Specifically, how many points in the standings a player helps a team earn compared to a replacement level player.  Enter PAR.  This method of player valuation is something I’ve been working on for quite some time.  It was my goal to complete this effort this past winter and get it up and running before Opening Day.  I made decent progress, but hit a major snag:  my numbers just weren’t adding up.  Specifically, I wasn’t getting anywhere near the expected results in the ratio categories (AVG, ERA and WHIP).  This led to flawed numbers across the board, so I had decided to table it until next winter.  But then a couple weeks ago, I was reading a fantasy baseball article on FanGraphs which contained a link to a second article and then a link to another site.  Suddenly, before my eyes was the exact solution I had been looking for, particularly for fixing my problem with ratio categories.  On one hand, I was a little upset that I hadn’t found (or really even looked for) this site before.  But on the other hand, it was extremely rewarding to discover that fantasy gurus had come up with methods of player valuation that were nearly identical to what I had come up with on my own.  So I think this should give my new stat a little credibility.

Here’s the page I discovered on a site called Smart Fantasy Baseball.  It’s definitely worth checking out because it probably describes the concepts a lot more clearly than I will be able to.  But what I’ve come up with is not exactly the same, so I will describe PAR in all of its gory details in just a bit.  The linked page describes a concept of player valuation called “Standings Gain Points” or SGP.  So I could have called this new stat SGP as well, but I had already picked PAR before I ever saw anything about SGP.  The concept is the same though.  SGP is the number of points in the standings that a particular player earns for his team.  There is a replacement level concept built into it as well, but that is where my formula is a little different.  One thing to keep in mind is that SGP, and probably other stats like it, are primarily designed to assign values to players to assist with draft preparation or to set future performance projections.  Most of the big sites that develop pre-season player rankings probably incorporate these ideas into their rankings and dollar value assignments.  But that’s not what I’m looking to do here.  I don’t intend to use PAR in pre-season projections or rankings, partly because I assume you all have your own methods of draft preparation (or lack thereof) that you do on your own anyway.

My intent with PAR is to assign a specific value to the numbers actually accumulated throughout the season in this league.  The formula is based solely on numbers (past and present) from this league.  Many of you probably occasionally glance at player ratings on other sites, which certainly have some value.  But they are usually based on default league settings on those specific sites.  PAR is completely based on our league’s settings and historical results.

So let’s get to it.  Here is my best attempt to describe what PAR is.  I’ll leave it to you to determine if it is a worthwhile metric, or completely useless information.  I’m not going to go through all of the math involved, but will provide enough information that you could “check my work” if you so desire.  Or if you are a very trusting person, you can immediately buy into this new stat as gospel truth and stop reading now.

As mentioned, the idea behind PAR is to determine how many points a player helps a team gain in the standings.  For now, only the raw total PAR is displayed on this site, but it is made up of 5 sub-parts:  one for each of the five categories a player helps contribute towards, which are obviously different for hitters than pitchers.  For each of those sub-parts there are two key numbers involved:  the “replacement level” stat total and the number of units in the category necessary to gain a point in the standings.  But before we dive into those, let’s talk sample size, which is applicable to all that follows.

All of the numbers that feed into PAR come straight out of this league.  At first I thought about only using numbers from the specific season for which I was calculating a player’s PAR.  After all, this would seem to be the best true measure of a player’s value in a given season.  But then I decided this was much too small of a sample size and could be totally thrown out of whack by teams that decided to punt certain categories.  Also, I didn’t want a player who puts up identical numbers in consecutive seasons to potentially have a significantly different PAR for those two years.  So I decided to expand it to a five year sample size.  I chose five years, and not the entire league history, because as you are well aware, there have been major peaks and valleys in offensive production in baseball during the two decades this league has existed.  If I were to use the same numbers to calculate PAR in 2014 as 2001, very few offensive players would have positive value now, while most pitchers would have accumulated negative value during the heart of the “steroid era”, which doesn’t really make sense since there are just as many points to be gained in offensive categories now as there were then.  So I picked five years to produce a decent sample size that wouldn’t be totally ruined by seismic era shifts.  I’ll have more to stay about this later, but now let’s start looking at how players earn points.  I’m going to focus mostly on the counting categories for now, but I’ll get to a separate discussion about the ratio categories (AVG, ERA, WHIP) later.

To determine what it takes to earn a full point in a given category, I came up with a method of calculating the “average” gap between teams in the standings in that category.  Average is in quotes because it is not exactly the mathematical average, which would only rely on teams that finish in first and last place to calculate this gap.  Initially, that’s exactly what I did.  But then I found that Smart Fantasy Baseball article, which recommended calculating this gap using a slope formula to create a linear distribution.  Check out that article again for the full details, but the main reason to use a slope formula is because it lessens the impact of outliers and includes all teams in the calculation, not just the first and last place squads.  The slope is calculated in each category and averaged over the five year period.  The table a little further down the page displays the calculated values for each category that were used for the 2013 PAR numbers, and will be used in-season for 2014 as well.  So, for example, the calculated gap of 10.05 for home runs means that it generally takes 10 home runs to gain a point in the standings.  Therefore, a player who hits 10 home runs above replacement level will earn a full point towards his PAR for home runs alone.  And for every additional 10 home runs he hits above that, he earns yet another full point.

Now let’s dive into the replacement level discussion, which is where my method is actually quite different than what I found on other sites.  Replacement level is one of the more controversial aspects of WAR because not everyone agrees on what it should mean.  In fact, prior to a year ago, the two mainstream producers of WAR (FanGraphs and Baseball-Reference) used completely different formulas to determine replacement level.  They have since unified, but it is still far from a 100% agreed upon standard.  This is also a challenge in fantasy player valuation.  Smart Fantasy Baseball’s approach was to set the replacement level baseline based on the projections of players who would just miss being drafted, so basically the best remaining players in the post-draft free agent pool.  This totally makes sense since those guys would be the true replacements for injured/under-performing players.  But keep in mind that I’m not creating a projection system.  I want to use real stats.  And trying to identify who the best available players are in the free agent pool at any given time is not really doable programmatically, especially since we use such a limited pool of players.  So I decided to go a different route.

The definition of a replacement level player that I came up with is an average player on a team that will finish in last place in any given category.  So basically, for the counting stats (HR, RBI, R, SB, W, SV, K), I determined the typical last place team total in each category and divided that by 14 for the hitting categories and 9 for the pitching categories (14 and 9 being the number of active hitter/pitcher roster spots).  This produces the units that a “replacement level” player would be expected to accumulate in each category assuming he was on the major league roster for the full season.  Wait a second, what does “typical last place team” mean?  Well, I could have just taken the five year average of last place teams in each category.  But again, I didn’t want my numbers to be drastically swayed by teams that intentionally tanked categories.  So instead, I calculated the average team total in each category over a five year span and subtracted from that the “gap” value described above times 4.5.  4.5 because an “average” team would earn 5.5 points in the category, but I’m looking for a total for the team that finished with 1 point (last place).  So this replacement level value is what a last place team would accumulate if all of the team totals truly formed a linear distribution.

The calculated point differences and replacement level numbers for each category are in the table below.  These were the numbers I used for the 2013 PAR calculations and will be used in-season for 2014 as well.

Category Point Diff. Gap Replacement Level
AVG .0029 .2583
HR 10.05 15.74
RBI 24.55 65.24
R 25.35 66.52
SB 11.02 7.36
ERA 0.109 4.065
WHIP 0.0195 1.3162
W 2.91 7.46
SV 10.54 5.02
K 30.60 113.25

Now let’s do some math and examine exactly how these numbers came about in one category, home runs.  From 2009 through 2013, the average team total in home runs was 265.66.  Using the slope function on each set of 10 team totals (one for each season), the average of those five results is 10.05, which becomes the point difference gap you see in the above table.  The formula to determine the replacement level is:  ((total team average) – (4.5 x point diff gap)) / 14.  So the calculation for the home run replacement level is:  (265.66 – (4.5 x 10.05)) / 14 = 15.74.

Besides all of that, there are other numbers involved in calculating PAR.  Obviously, a player’s actual stats are included.  But also a new stat that I needed to start tracking in order to make this work:  number of weeks on the active roster.  This is important because I wanted to make PAR a cumulative stat, like WAR, meaning that a player will “earn” value throughout the season towards an end of the year total, but only while on the active roster.  Without tracking weeks on the roster, players who only spend a short period of time on the roster would post a PAR way below zero since they would likely fall well short of the full season replacement level totals.  But this would be misleading because their contribution is not necessarily negative for the team if they produce good numbers during that brief stint.  So another aspect of the PAR formula is multiplying the replacement value by a ratio of the number of weeks a player is on the active roster over 26.  26 is the full number of weeks in the baseball season.  Therefore, a player on the active roster for exactly half the season (13 weeks) would only need to accumulate half of the replacement level total in order to start earning positive value.

Here is an example of the home run part of the PAR calculation for Jose Bautista in 2013.  He hit 28 home runs in 21 active weeks on the roster, so that’s why those two numbers appear:  (28 – (15.74 x (21/26))) / 10.05 = 1.52.  So Bautista earned 1.52 “points” for HR, which was then added with the four other parts to create a total of 3.6 PAR for the 2013 season.

I’ve kind of been glossing over the ratio categories to this point.  The number of weeks on the active roster is not used for these categories because we have a better way of determining how much of an impact a player has on those categories:  their actual number of at bats or innings pitched.  In batting average, the first thing needed is the average number of at bats per player over the 5 year span.  This was calculated by taking the total number of at bats in the league over those five years and dividing it by 700 (50 team totals and 14 slots per team).  This came to a total of 531.04 at bats.  Next, the previously calculated replacement level batting average was used to find the replacement level hits:  (.2583 x 531.04) = 137.28.  So our replacement level hitter has about 137 hits and 531 at bats.  The individual player AVG PAR is calculated by taking a team full of replacement level players plus the player being examined.  That’s 13 replacement players plus the examined player to fill up the full 14 slots:  ((137 x 13) + player’s hits) / (531 x 13) + player’s at bats)) = adjusted batting average.  The adjusted batting average will show how much of an effect the player had on the team batting average.  The rest of the calculation is the same as the other categories.  The concept for ERA and WHIP is similar, except the replacement level innings, earned runs, and walks plus hits are calculated and used instead.  This whole paragraph probably makes zero sense, so I once again refer you to the Smart Fantasy Baseball article to get a better grasp on this.  Just keep in mind that I’m using replacement level players instead of average players.  The concept is more or less the same though.

Now that I’ve described how PAR is calculated, let’s see if the numbers add up.  On a team-by-team basis, you would expect the total batting PAR to be approximately the team’s batting total minus 5 since a team full of replacement level players would still “earn” 5 batting points.  The same applies for pitching.  But looking at individual team PAR totals can be misleading since some teams might win a category convincingly, earning more than the necessary nine points above replacement, in turn skewing the overall numbers.  So a better way to analyze the results is to add up league-wide totals in each sub-part (category) of PAR.  You would expect the league wide total PAR earned in each category to be somewhere around 45 (9 + 8 + 7 + 6 … + 1).  My calculations for the 2013 season produced the following total PAR in each category:

  • Average:  38.27
  • Home Runs:  30.28
  • Runs Batted In:  22.72
  • Runs Scored:  28.12
  • Stolen Bases:  34.84
  • Earned Run Average:  50.73
  • WHIP Ratio:  58.04
  • Wins:  38.26
  • Saves:  49.17
  • Strike Outs:  49.92

In summary, some categories came closer to the expected result than others.  But even the ones that aren’t close are explainable and not necessarily a sign of a flawed system.  In particular, the league totals in HR, RBI and R were significantly lower in 2013 than over the course of the five year span we examined.  Therefore, I would actually expect these numbers to be well below 45.  To what degree is hard to calculate, but overall, I am satisfied with the results.  Just keep in mind that when I start releasing the PAR numbers for earlier seasons, we should start to see the opposite situation where offensive points earned exceed the expected totals.  I really won’t know for sure how iron clad this formula is until I complete this task for the full league history, and that is going to take a while.  There is a decent chance I will tweak the formula as I proceed.

Next, I’m going to explain a little about how you should interpret these PAR numbers and possibly add a few words of warning to clear up some potential misconceptions.  First, and in my opinion most importantly, keep in mind that there is no positional adjustment included in these ratings.  PAR is calculated using the same numbers for catchers as outfielders.  Positional strength plays no role.  Since it is much more difficult to get great value out of certain positions, you shouldn’t simply decide Player A is more valuable than Player B based on a higher PAR if they play different positions.  A catcher with a 3.0 PAR is probably more valuable than an outfielder with the same PAR.  Down the road, I intend to come up with a second new stat, closely related to PAR, which will include a positional adjustment.  But that’s not going to happen anytime soon.

This lack of a positional adjustment is especially noticeable for pitchers.  Relief pitchers, due to their reduced innings and lack of win opportunities, are going to have a tough time earning positive value.  Almost all non-closers are going to have negative PAR.  This may seem like a huge red flag and a flaw in the system.  But I don’t think it is.  These numbers accurately reflect how much more of an impact starting pitchers have on a team’s total stats compared to relievers.  This is not to say relief pitchers have no value though.  A 0.0 PAR player still helps a team more than a -2.0 player.

Similarly, it is a mistake to make direct comparisons between hitters and pitchers based on PAR.  In general, pitchers are going to have higher PAR than hitters.  The reason for this is because there are just as many points to be gained in the standings in pitching categories as hitting, yet there are far fewer pitchers earning those points so there are more points to go around to each player.  I considered adding an adjustment to pitchers’ PAR to make the average pitcher’s PAR equivalent to an average hitter.  But I decided against it because I wanted to maintain the goal of total league-wide PAR matching the numbers of points actually available in the league standings.  So keep this in mind when comparing the value of a hitter to a pitcher.

One false impression you could receive from PAR is that your team would be better off with an empty roster spot than playing a guy who is earning negative value.  This is not the case.  A negative value means that the player is providing less value than a replacement player, but a replacement player is more valuable than no player at all.  To illustrate this, let’s say you decide to go the full season with just one healthy catcher and a second catcher who misses the entire season with an injury.  A hypothetical player who puts up zeros in all five categories for the full season would earn a -7.5 PAR.  It would be nearly impossible for any real player to put up a PAR worse than that.  Same goes with pitching.  A pitcher with no stats for a full season would accumulate a -6.7 PAR.  Keep that in mind when determining if it makes sense to play a man short rather than using the below replacement level player on your bench.

This may be obvious, but simply accumulating the highest team PAR does not guarantee you a championship.  It is very possible to accumulate a category PAR total that is more than the full nine points necessary to finish first in that category.  Ideally, you want to accumulate close to nine points in each of the categories you intend to win.  Of course, it’s not really possible to see what your PAR is in each category right now, but this is something I hope to add in the future.

Finally, I suggest you pay little attention to the PAR values that are included in the “MLB” lines of a players’ stats for the current season.  Since I don’t have a good way of determining how many weeks a player has been on an active MLB roster, I’m assuming they have been active the full season, which is obviously not the case for a great number of players.  I thought about not calculating these numbers at all, but decided the information could be useful to see how valuable your bench players or free agents have been.  For now, I’m not calculating PAR for the weekly stat lines, but I may add that later.

So what comes next?  At the moment, the web site contains PAR numbers for the 2013 and 2014 seasons.  The 2014 numbers will be updated every morning as part of the daily stats update.  One thing to keep in mind is that at the beginning of each week most active players’ PAR will take a slight hit as the number of weeks value that is included in the calculations is incremented by one.  This will be barely noticeable later in the season, but you might see some guys drop a tenth of a point or two right now simply for that reason.  I’m going to take a closer look at the year-by-year results in separate posts as I release those numbers to the site.  I’ll analyze the 2013 numbers in greater detail very soon.  Then I will start working my way backwards starting with 2012.  I don’t expect to finish this project until next winter.  I’m definitely going to need to make some changes to the formula as I approach the early seasons of this league when there were fewer teams and fewer points available.  I have no idea how I’m going to do that right now, but I have plenty of time to think about that.

Wow, that’s one of the longest things I’ve written since college.  I hope you find some of this information helpful in understanding the new stat.  More importantly, I hope you find PAR to be a useful tool in analyzing players’ value in this league.  This is definitely a work in progress and I am very willing to make adjustments.  So if you find flaws in my system or think there are ways I can improve it, don’t hesitate to let me know.  Also, I’m sure there is much of what I described that is not clear to you at the moment.  Please leave me feedback on any questions or comments you have.  Enjoy!

Blog Change

Saturday, May 3rd, 2014

This post really belongs in my web site update thread, but I’m putting it here to do a live test to make sure my latest changes are working properly.

For years, I’ve been using player action photos in my blog entries, but like a vast majority of small-time bloggers, have done so on somewhat shaky legal ground.  I’ve always been on the look-out for a more legitimate, and free, way of obtaining photos to embed in my posts.  Fortunately, such a source is now available to me.

A couple months ago, Getty Images, one of the largest image repositories (if not THE largest), announced that they would start allowing almost all of their millions of photos to be embedded in non-commercial web sites, blog posts and social media outlets.  So, starting with this post, I plan on taking advantage of this.  I will embed photos from Getty in all of my future posts.

As you can see, the embedded image contains links to share the photo as well as a link back to the original Getty host page if you click the photo.  The one negative about the manner in which Getty has decided to make these photos available is that most industry insiders believe they will ultimately go the route of YouTube and include ads in these photos, one way or another.  If/when that occurs, I may revisit this topic.  But in the meantime, I think this should work great for this blog.

Mostly coincidental, the timing of this change is just about perfect.  Mike has offered to start writing a semi-regular feature for the DTBL News.  I’d hate to put our resident patent examiner in the awkward position of potentially breaking an intellectual property law, but now we don’t have to worry about that.  I’m not going to spoil the theme of Mike’s article, but look for the first one to be posted very soon.

And on that note, if anybody else is interested in contributing to the DTBL News, whether it be occasional features or even a one time article, please contact me.  I highly encourage this.  You all already have the ability to create blog entries, but I would like to pass along some tips for keeping the posts consistent and compatible with the main site page.

Finally, I should mention one other temporary change to the site.  In working on this new photo embedding feature, I had to upgrade this WordPress software since it was several years out-of-date.  Unfortunately, in doing so, I had to remove the single sign-on bridge which allowed us to use the same logon account for the main web site, the message board forum and this blog.  That bridge is not compatible with newer versions of WordPress and is no longer supported by the original developer.  So I’m going to be looking for a replacement.  But in the meantime, if you are logged onto your regular site account, you will still be able to make forum posts, but won’t be able to reply to blog posts or create your own blog entries without a separate log on.  I should be able to fix this relatively soon though, so this is just a heads up.

A Strikeout Epidemic

Saturday, May 11th, 2013

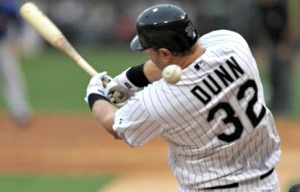
First baseman Adam Dunn

It has been 15 years since I played competitive, organized baseball.  Although I never played above the high school level, I think I can accurately say that many things in the sport have changed over those 15 years.  One of those things is the perception and proliferation of strikeouts, both from a hitter’s and a pitcher’s point of view.  Aside from losing, there was nothing I hated more as a baseball player than finishing an at bat with a strikeout.  I would try my best to make sure that didn’t happen (often unsuccessfully).  I would shorten my swing with two strikes, choke up on the bat, and generally do whatever I could to put the ball in play.

I believe a majority of professional hitters used to have a similar approach.  But I seriously doubt this is still the case.  The numbers would certainly indicate otherwise.  Today, Major League hitters are striking out at record breaking rates.  So far in 2013, teams are averaging 7.63 strike outs per game.  This is well ahead of last year’s all time high of 7.50.  Just five years ago, that number was 6.34 and a decade ago it was 5.80.  That is a pretty incredible increase in whiffs in just a ten year period.  And it’s having a major impact on the game.  Scoring is down to just 4.25 runs per team, per game.  That is the lowest rate since 1992.  The significant increase in drug testing is the most cited reason for the drop in offense in recent years, and I think that is a completely valid reason.  But the inability of hitters to put the ball in play is a major factor as well.

So let’s figure out why this is happening.  Are pitchers just better than they were ten years ago?  Do they throw nastier offspeed pitchers that are tougher to hit?  Are teams more willing to promote and play guys who sacrifice contact for power?  Or, in general, do today’s hitters step up to the plate with significantly different approaches to hitting than the players from previous generations?  In my opinion, the answer to those questions are yes, yes, yes and yes.  The end result is less scoring and a whole lot more whiffing.

During the Moneyball era of about a decade ago, the emerging philosophy to hitting was to take more walks.  Do whatever it takes to get on base.  Working a count in an attempt to walk naturally leads to more strikeouts as well.  There has always been a place in baseball for guys who strike out a ton, but hit for power and also receive more than their share of walks.  But what’s really interesting about the recent surge in strikeouts is that there has been no increase in walks at all.  In fact, last season’s 3.03 walks per team, per game was the lowest rate since 1968!  So the Moneyball era is clearly over.  What we have now is something entirely different.  It’s a pitching dominated league in which hitters struggle to reach base and strike out a ton.  And I hate it!

This season, only one team has a worse offensive K/BB rate than my very own White Sox.  But since the Astros are fielding an AAA roster, I’ll put them aside and focus on the Sox instead.  They are the perfect example of what is wrong with today’s general approach to hitting.  Sure, they have plenty of guys who can hit home runs.  They have the 4th highest HR ratio in the league.  Yet only the Marlins and Dodgers score fewer runs per game.  This is because the Sox strike out at the third highest rate (an alarming 23.7% of their plate appearances end in strikeouts), yet find themselves as the least walked team in all of baseball!  Home runs are great.  I would much rather have guys who hit them than guys who don’t.  But if you field a lineup full of players who don’t take walks and constantly strike out, you are going to struggle to score and will lose a lot of games.  That is exactly what is happening to the Sox this year.  Their leadoff hitter, Alejandro De Aza, has 42 strike outs (tied with teammate Adam Dunn for 9th in MLB).  Their #2 hitter, Jeff Keppinger, has not taken a walk this season in 117 plate appearances.  His laughably pathetic .188 OBP is somehow lower than his batting average.  After looking at the numbers from De Aza and Keppinger, it is no wonder why the Sox struggle to score.  They never have anybody on base when the heart of the order comes up.  The White Sox are hardly alone in their poor plate discipline numbers, but they are the best example of the current trend in the game.

As a quick aside, have I ever mentioned how much I love Baseball-Reference and FanGraphs?  Easily my two favorite web sites.  All of the numbers I am quoting in this article came from one or the other.  Which leads me to my next topic.  FanGraphs has advanced stats in a category called “Plate Discipline”.  Here is a FG page displaying league-wide plate discipline stats for the past ten years.  These stats show how often players swing at, and make contact with, pitches inside and outside the strike zone.  For the most part, there haven’t been dramatic changes in these stats over this ten year period, except in three key categories:  O-Swing% (percentage of pitches a batter swings at outside the strike zone), O-Contact% (percentage of pitches a batter makes contact with outside the strike zone when swinging the bat) and Zone% (overall percentage of pitches a batter sees inside the strike zone).  The O-Swing% and O-Contact% numbers have been creeping up, despite the overall swing and contact percentages remaining relatively steady.  This means hitters are swinging at far more pitches outside of the zone than they used to.  And they are seeing fewer strikes as a result (Zone% number has been trending downward).  So hitters are swinging at more bad pitches, allowing pitchers to throw fewer strikes yet walk about the same, if not fewer hitters.

To me, these numbers scream out that there is a problem with plate discipline in baseball right now.  I’m not discounting the possibility that pitchers are simply getting better and are harder to hit.  In fact, I am almost certain that is the case.  But if I were a MLB general manager, I would definitely start looking for hitters who are more disciplined at the plate.  It might be time to go back to the Moneyball approach, with a twist.  It is fine to have a few hackers in the lineup, but you better find some players who will take a walk too.  And it isn’t the worst thing in the world to employ hitters who are  head and shoulders above their peers in terms of putting the ball in play, particularly if they bring other skills to the table like speed, elite defense, or maybe even decent power.

I think there has been less of a change in how pitchers are viewed.  Strikeout pitchers have almost always been preferred over pitch-to-contact guys in the eyes of scouts and baseball execs.  Pitchers have a difficult time advancing through a system if they don’t produce impressive strikeout ratios.  This is nothing new.  But there has definitely been a decrease in the number of successful pitch-to-contact pitchers in the big leagues.  I saw one such pitcher in person just last night.  Nationals young lefty Ross Detwiler is a rare breed in today’s game.  He is a hard throwing lefty who just doesn’t strike out many hitters, but is still a very effective pitcher.  But I would have a hard time naming more than a couple other similar type of pitchers.

I’d like to delve into the pitching side of things to a much greater extent some other time.  For now, I’m concluding that poor plate discipline and the willingness of teams to play guys who struggle to hit a baseball are leading factors in why we are seeing more strikeouts than ever before.  As one who despises strikeouts from a hitting perspective, I can only hope this trend will stop sometime soon.

By the way, I had been planning on writing about this topic for a few weeks now, but happened to read a great article by CBS’s Scott Miller on this very thing just a few days ago.  I highly recommend his article which is obviously much more professional and thorough than mine.  You should check it out too.

My American Dream Team

Wednesday, March 6th, 2013

The 2013 World Baseball Classic began in Southeast Asia this past weekend.  The North American pools begin play tomorrow.  I’m a sucker for pretty much any international athletic competition, and baseball is my favorite sport, so it would seem only natural that I would be excited about the WBC.  But that’s not quite the case.  I will certainly watch it, but I will do so knowing that this is not the ideal way of crowning a true World Champion.

The flaws of the WBC are many, but #1 on the list for me is that a majority of the sport’s best players will not be participating, particularly those who could be representing the United States.  I don’t blame any of the individual players for not participating and I’m not sure there is anything MLB or the tournament organizers could do to change this, but it certainly hurts the tournament.

Team USA suffered a blow yesterday when they lost their presumed starting first baseman, Mark Teixeira, to a wrist injury.  He was replaced on the roster by Eric Hosmer.  Due to the last minute nature of Teixeira’s injury, I realize the options were probably quite limited in finding a replacement.  But if I were to compile a list of the top 10 American first basemen, I’m not sure Hosmer would make that list.  Meanwhile, a player who probably would rank ahead of him, Anthony Rizzo, is competing for Team Italy.  Don’t get me started on the ridiculousness of that…  But the point is, Team USA is clearly not as strong as they could be.  I decided to take a crack at compiling my ideal roster for the USA.  This team would be prohibitive favorites to win the competition, rather than just one of several countries with a decent shot at it.

Players who are actually on the USA’s WBC roster are italicized.

My starting lineup:

1.  Mike Trout, RF

2.  Andrew McCutchen, CF

3.  Ryan Braun, LF

4.  Prince Fielder, 1B

5.  Giancarlo Stanton, DH

6.  David Wright, 3B

7.  Troy Tulowitzki, SS

8.  Buster Posey, C

9.  Dustin Pedroia, 2B

Reserves:

Catchers – Joe Mauer

Infielders – Evan Longoria, Ben Zobrist (just so I have someone who can back up any position)

Outfielders – Matt Kemp, Josh Hamilton

Starting Pitchers:

Justin Verlander, Clayton Kershaw, Stephen Strasburg, David Price

Bullpen (I’ll use a couple regular SPs out of the pen):

Craig Kimbrel, Jonathan Papelbon, Jason Motte, J.J. Putz, Matt Cain, Chris Sale, Glen Perkins, Tyler Clippard, David Hernandez, Jonny Venters

No other country could come close to putting together a roster with that sort of depth.  Not that it would guarantee victory in a tournament with so few games, but I’d take my chances with this squad.  Only eight of my choices are on the actual team, and none of them are starting pitchers.  No offense to Ross Detwiler, Ryan Vogelsong and Derek Holland, but they are quite a drop off from the rotation I compiled.

Happy 20th Anniversary!

Friday, January 18th, 2013

20 years ago today, January 18, 1993, five kids met in a basement to try out this thing called fantasy baseball.  Of course, I, and some of you, were those kids.  The league didn’t even have a name yet, but with the kick-off of the inaugural league draft that day, the Dream Team Baseball League was officially launched.  Two decades later, here we are still taking part in what has to be one of the longest running fantasy baseball leagues to have been started by a bunch of junior high kids.

Sometime soon, I need to put all of the early history of the DTBL in writing before it completely escapes my memory.  But for today, I’ll just write about some of what I recall from that inaugural draft.  It will be a quick trip down memory lane for some of you, and for the rest, you may learn a little bit about how this whole thing got started.  That first draft was extremely significant not just because it was the beginning of the league, but because one team used it to build the league’s first dynasty.

It was Martin Luther King Day 1993.  Current DTBL members Kelly, Charlie, Greg and myself, along with former member Peter, gathered in my family’s basement.  It was the last day of a three day weekend.  Four of us were in seventh grade and one in sixth at the time.  My youngest sister, who is currently a sophomore in college, was born three weeks after the draft.  Obviously, we all had a keen interest in baseball, but I don’t think any of us knew exactly what we were getting ourselves into.  We had certainly never played fantasy baseball before, and I think only I had even heard of it.  But I explained to the others what I had learned from reading about the game, established some rules, and organized the draft.

In preparation for the draft, I attempted to set up the basement to mimic the NFL draft rooms I had seen on TV.  Each person had a table/desk with a team placard to mark their spot.  There was a makeshift podium from which the teams announced their selections.  When picks were made, the selected player’s baseball card was taped onto the wall next to a team pennant:  a draft board, of sorts.  I had printed out “newsletters” for each owner, containing the list of eligible players and stats.  As I type this, I’m staring at my old copy of that original newsletter.  Reading through it, some of it is quite embarrassing, until I remind myself I was 13 years old when I wrote these things.

Although I don’t remember how long the draft ran, it could not have been short.  It lasted 28 rounds, allowing each team to fill their entire roster.  Our naivety towards fantasy baseball was evident right from the start.  The first round was filled with picks of personal favorites (Choppers:  Greg Maddux, Kings:  Frank Thomas) and past-their-prime stars (Gators:  Kirby Puckett, Cougars:  Joe Carter).  We drew numbers to determine the draft order, but wisely used a serpentine draft order for the only time in league history.  Greg selected Puckett with the first pick, effectively making him the league’s first official player.  Maddux went second, Ken Griffey Jr. third (to the Panthers), Thomas fourth and Carter fifth.

Joe Carter may have been a questionable choice by the Cougars in the first round (although he was the World Series hero that year), but the totality of their 1993 draft was the best dynasty building event this league has ever seen.  They heisted Barry Bonds in the fourth (!!!) round.  Yes, this was pre-steroids Bonds, but he was already well established as one of the best players in baseball, and especially in fantasy baseball, coming off a 34 HR, 39 SB ’92 season.  Their next pick after Bonds was quite a steal as well:  Albert Belle.  Then came Barry Larkin in round six.  But they weren’t done drafting potential future Hall of Famers.  In round 18 it was Craig Biggio, Ivan Rodriguez in 19 and Kenny Lofton in the 22nd round.  Though Kelly was the youngest one in the group, she certainly outsmarted the rest of us that day.  The end result of that super draft class?  Three titles in the league’s first four years.  This season will also be the 20th anniversary of the Cougars’ 1993 title.

As we progress through 2013, I may have some more 20th anniversary features, but I figured it would be nice to take a quick stroll down memory lane on this milestone date.  Looking ahead to our 2013 season, roster cuts will be due soon.  I will send details in an email.

Happy Anniversary!

Jackalope remain, Darkhorses return to elite status

Monday, April 30th, 2012

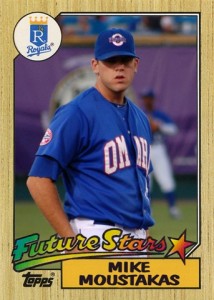
Mike Moustakas, 3B

Jackalope

Projected Finish: Third

2011 Finish: First

AVG: C … HR: A … R: C … RBI: B … SB: B … W: A … ERA: F … WHIP: F … K: B … SV: A

Marc’s favorite draft pick: Sean Marshall, Round 12 – Mr. Irrelevant could be a gem with the injury to Ryan Madson

Jay’s favorite draft picks: Mike Moustakas, Round 3 / Paul Goldschmidt, Round 4 – A pair to tidy up the corners as well as provide some pop while Ryan Howard nurses his Achilles.

Overview: The Jackalope broke through last year from being a team with a great SP staff to simply a great team. The addition of Mike Stanton provided a much-needed power boost to move the Jackalope to the fourth-best offense and top overall team in the league in 2011.

The 2012 Jackalope are ready to pick up where the 2011 squad left off. Howie Kendrick (Round 1) and Chris Young (Round 2) were among the best veteran DTBL players in the draft pool. By drafting every RP with ties to the Reds, the Jackalope ensured they will get any save opportunity to emerge from the Queen City – unless the Red lose, of course.

Darkhorses

Projected Finish: Second

2011 Finish: Seventh

AVG: A … HR: D … R: B … RBI: C … SB: A … W: B … ERA: A … WHIP: C … K: C … SV: A

Marc’s favorite draft pick: Zack Cozart, Round 10 – seemed like a lot of publications were down on him following surgery on his non-throwing arm

Dave’s favorite draft pick: Matt Moore, Round 1 – An expected ace who could help drive the Darkhorses’ SP staff back to prominence; Moore and Strasburg stood a tier above the rest of the SP pool

Overview: After four consecutive DTBL titles (including one tie), the Darkhorses finally took a step back in 2011.

Other than in the first round, the 2012 draft saw the Darkhorses follow their regular blueprint of drafting more established players rather than splurging on DTBL rookies. Among the rookies drafted by the D’horses, Jordan Walden entered the year looking like one of the top up-and-coming firemen in the league.

(note: Injuries have taken a serious toll on the Darkhorses already this year, with the losses of Jacoby Ellsbury, Chris Carpenter and Brian Wilson)

Bootleggers, Wonderboy and other mythological figures are stuck in the middle

Thursday, April 26th, 2012

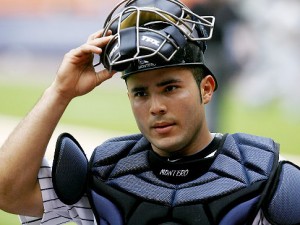
Jesus Montero

The first month of the season is coming close to being in the books – yet I still haven’t finished all these team “previews.” It seems pretty ridiculous to write team blurbs at this point, so I’ll post the remaining draft grades along with favorite picks

Moonshiners

Projected Finish: Seventh

2011 Finish: Third

AVG: C .. HR: A … R: A … RBI: A … SB: D … W: F … ERA: F … WHIP: F … K: D … SV: C

Marc’s favorite draft pick: Emilio Bonifacio, Round 5 – Had a great 2011, qualifies at SS and his name is fun to say!

Mike’s favorite draft pick: David Freese, Round 6 – World Series MVP has had trouble staying healthy, but he was one of the more solid hitters at a thin 3B

Naturals

Projected Finish: Sixth

2011 Finish: Second

AVG: A … HR: C … R: C … RBI: C  … SB: C … W: F … ERA: C … WHIP: D … K: C … SV: C

Marc’s favorite draft pick: Nick Markakis, Round 4 – I refuse to believe that his power will not break through … some day

Nick’s favorite draft pick: Jesus Montero, Round 1 – expected to put up 1B-type numbers from the C position

Demigods

Projected Finish: Fourth

2011 Finish: Fifth

AVG: A … HR: B … R: B … RBI: B … SB: C … W: D … ERA: A … WHIP: A … K: F … SV: C

Marc’s favorite draft pick: Bud Norris, Round 12 – wildcard flier, could collect a lot of Ks

Dom’s favorite draft pick: Freddie Freeman, Round 1 – Seemed somewhat similar to Eric Hosmer, but wasn’t getting near as much hype

Mavs, Cougars and Gators projected to finish in DTBL cellar

Saturday, April 21st, 2012

The projections systems have the bottom of the DTBL standings in 2012 looking pretty much the same as in 2011. The Mavericks, Cougars and Gators are projected to place eighth, ninth and tenth, respectively

Cougars   – Projected Finish: Ninth                           2011 Finish: Tied-Ninth

AVG: D

HR: D

R: F

RBI: F

SB: F

W: A

ERA: C

WHIP: C

K: A

SV: F

Marc’s favorite draft pick: Brett Lawrie, Round 1 – the top player on my draft board

Kelly’s favorite draft pick: Brett Lawrie, Round 1 – expected to go 20/20 already this season

Overview: After tying for last place in 2011 and collecting just 12 batting points, the Cougars started 2012 by drafting a player in Lawrie who could help in all five offensive categories. The 2011 Cougars’ offense took quite a hit from the disappointing season by Adam Dunn, for whom the Cougars gave up a first-round pick to acquire, and Grady Sizemore finally wore out his welcome six seasons after being the no. 1 overall pick

However, pitching was an even bigger problem area last year, so the Cougars took two SPs and an RP in the next three rounds to go with their core of Madison Bumgarner and Daniel Hudson. The selection of Gio Gonzalez came a round after I expected the Cougars to add a pitcher from D.C. Perhaps the move to the NL and yet another change of scenery will help Gio lower his walk rate. If not, maybe White Sox GM Kenny Williams can trade for him just to trade him away for the third time.

Gators   – Projected Finish: Tenth                             2011 Finish: Tied-Ninth

AVG: F

HR: D

R: F

RBI: F

SB: F

W: F

ERA: B

WHIP: A

K: F

SV: F

Marc’s favorite draft pick: Derek Holland, Round 9 – free fell in the draft. Talented lefty in good position to pile up wins

Greg’s favorite draft pick: N/A

Overview: A year after posting the lowest batting point total in the history of the DTBL as a 10-team league, the Gators spent their first six draft picks attempting to bolster their hitting. The Gators traded the no. 2 and no. 12 picks in the draft to the Mavericks for power hitting Nelson Cruz and Mark Reynolds. Hitting was such a priority for the Gators coming into this season that they added just two pitchers – Greg Holland and Derek Holland – in the entire draft.

The Gators could benefit greatly if Kendrys Morales returns to being the hitter he was three seasons ago when he hit 11 home runs in 193 at-bats for the Gators before beginning a run of injuries upon reaching home plate in that 193rd at bat.

Mavericks   – Projected Finish: Eighth                     2011 Finish: Eighth

AVG: C

HR: F

R: B

RBI: D

SB: A

W: C

ERA: F

WHIP: D

K: B

SV: F

Marc’s favorite draft pick: Adam Dunn, Round 6 – I keep telling myself that 2011 had to be a fluke

Overview: Back-to-back eighth-place finishes prompted the Mavericks to accept a full rebuilding plan that involved trading two of their oldest players in Nelson Cruz and Mark Reynolds for draft picks that became highly touted SP Stephen Strasburg and OF Mike Trout. Drafting Trout 12th overall when it already was pretty much a sure thing he was starting the season in the minors was a clear sign that the Mavs were all in on going young.

The Mavs have six players on their roster who were taken in the first round over the past three drafts. If players such as Matt Wieters (10 Dft #1) and Jayson Heyward (11 Dft #1) can become the players they looked to be heading into their DTBL rookie seasons, the stale Mavs offense of 2011 could see solid improvement.

Grading the DTBL

Friday, April 13th, 2012

The 2012 season could be one of the most-wide open years in recent DTBL history, with a number of teams in position to compete for the title.

Over the next week I will post team overview snippets that include a letter grade for each of the 10 scoring categories for all teams. These grades are based on a combination of three player projection systems, and they rate a team against other DTBL teams.

The projections are the product of hard work from a friend of mine who is much more

proficient than I am at using spreadsheets. He built out full-year projections  using Pecota, Zips and a composite set of projections from MLB.com.

Thanks to those of you who responded so quickly with feedback on your draft! Also, as an FYI, unlike a certain league commissioner I didn’t rig these projections to brag about how great my team is